The valuation of damages is designed to put the harmed party back into the same economic position that would have existed if the harm had not occurred. The most difficult part of that equation is to project the economic conditions one would have expected without the harm. An analysis of historical results is often used to assist in making that forecast. In my last blog post, I discussed the pros and cons of four of the most commonly used methods to analyze a series of events, namely the mean, the median, exponential smoothing and regression analysis. This post will present two examples and show how each method impacts the damages calculation under each.
Example: Projecting Damages From Theft of Customer Lists – Upward Trend
Hypothetical ABC Co. is a distributor of household cleaning products to small retail stores. Although sales and profits fell during the beginning of the financial crisis in 2007, since then both have steadily increased. At the beginning of 2011, the national sales manager left ABC and took with him all of the contact information for ABC’s customers. He then went to work at a competitor and ABC experienced a drop in sales and profits. ABC has sued to recover damages from 2011 for lost profits caused by this theft of customer lists. Net profits from 2007 through 2011 were:
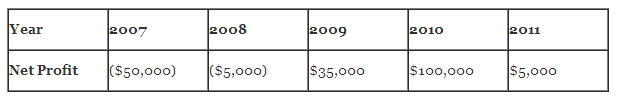
Let’s apply each of the four methods to project what 2011 profits would have been but for the theft of customer lists:
- Mean – the average of 2007 to 2010 profits is $20,000 (the sum of the four year’s profits divided by four).
- Median – there are two midpoints – ($5,000) and $35,000 – so the median would be the point halfway between the two or $15,000.
- Exponential smoothing – applying weights to each of the four years (1 for 2007, 2 for 2008, and so on) and then dividing the total by 10 – the sum of the weights – yields a projection of $44,500.
- Regression analysis – there is a clear upward trend that would imply that 2011 profits should be higher than previous year’s profits. Regression analysis yields a projection of $142,500.
In this example, regression analysis not only yields the highest projected value, but it supports the fact that profits had been steadily increasing over each of the past several years.
Example: Projecting Damages From Theft of Customer Lists – Fluctuating Levels of Profits
Using the same facts as in the first example, suppose that profits were fluctuating up and down over the past few years:
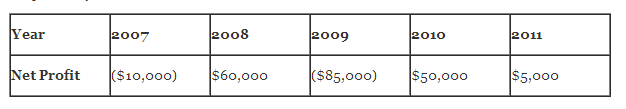
Applying each of the four methods to calculate damages for 2011 provides the following results:
- Mean – the average of 2007 to 2010 profits is $3,750.
- Median – the median would be the point halfway between ($10,000) and $50,000 or 20,000.
- Exponential smoothing – yields a projection of $5,500.
- Regression analysis – yields a projection of $12,500.
In this example, the median yields the highest value. Because there is no clear trend of growth or decline and a wide range of swings in value, the mean may be the most supportable of the values.
The above calculations are made in a vacuum and clearly there is not enough information in the fact patterns to suggest the best option in each case. The illustrations do highlight some of the mechanics behind the damages calculation, and the impact of using different conventions.